
Example: bottle filling
A technician measures five bottles from the same filling nozzle every 30 minutes. Keep the groups in collection order.
Download the bottle-filling example (CSV)This is the same example used in the tool’s Help tab: 175 measurements in 35 groups of five bottles. subgroup_id identifies the group; fill_volume_ml contains each bottle’s fill volume in mL. The other columns record order, collection time and position within the group.
1. Create the chart workspace
In the sidebar, open Process control, choose X̄–R Chart, and name the analysis. Select New blank worksheet and Create analysis.
2. Import the data
On Worksheet, choose Import. Select the downloaded file or paste its contents. Set the delimiter to Comma, use Decimal dot, and check First row contains column names. Preview the import, then choose Import into worksheet.
3. Assign the input columns
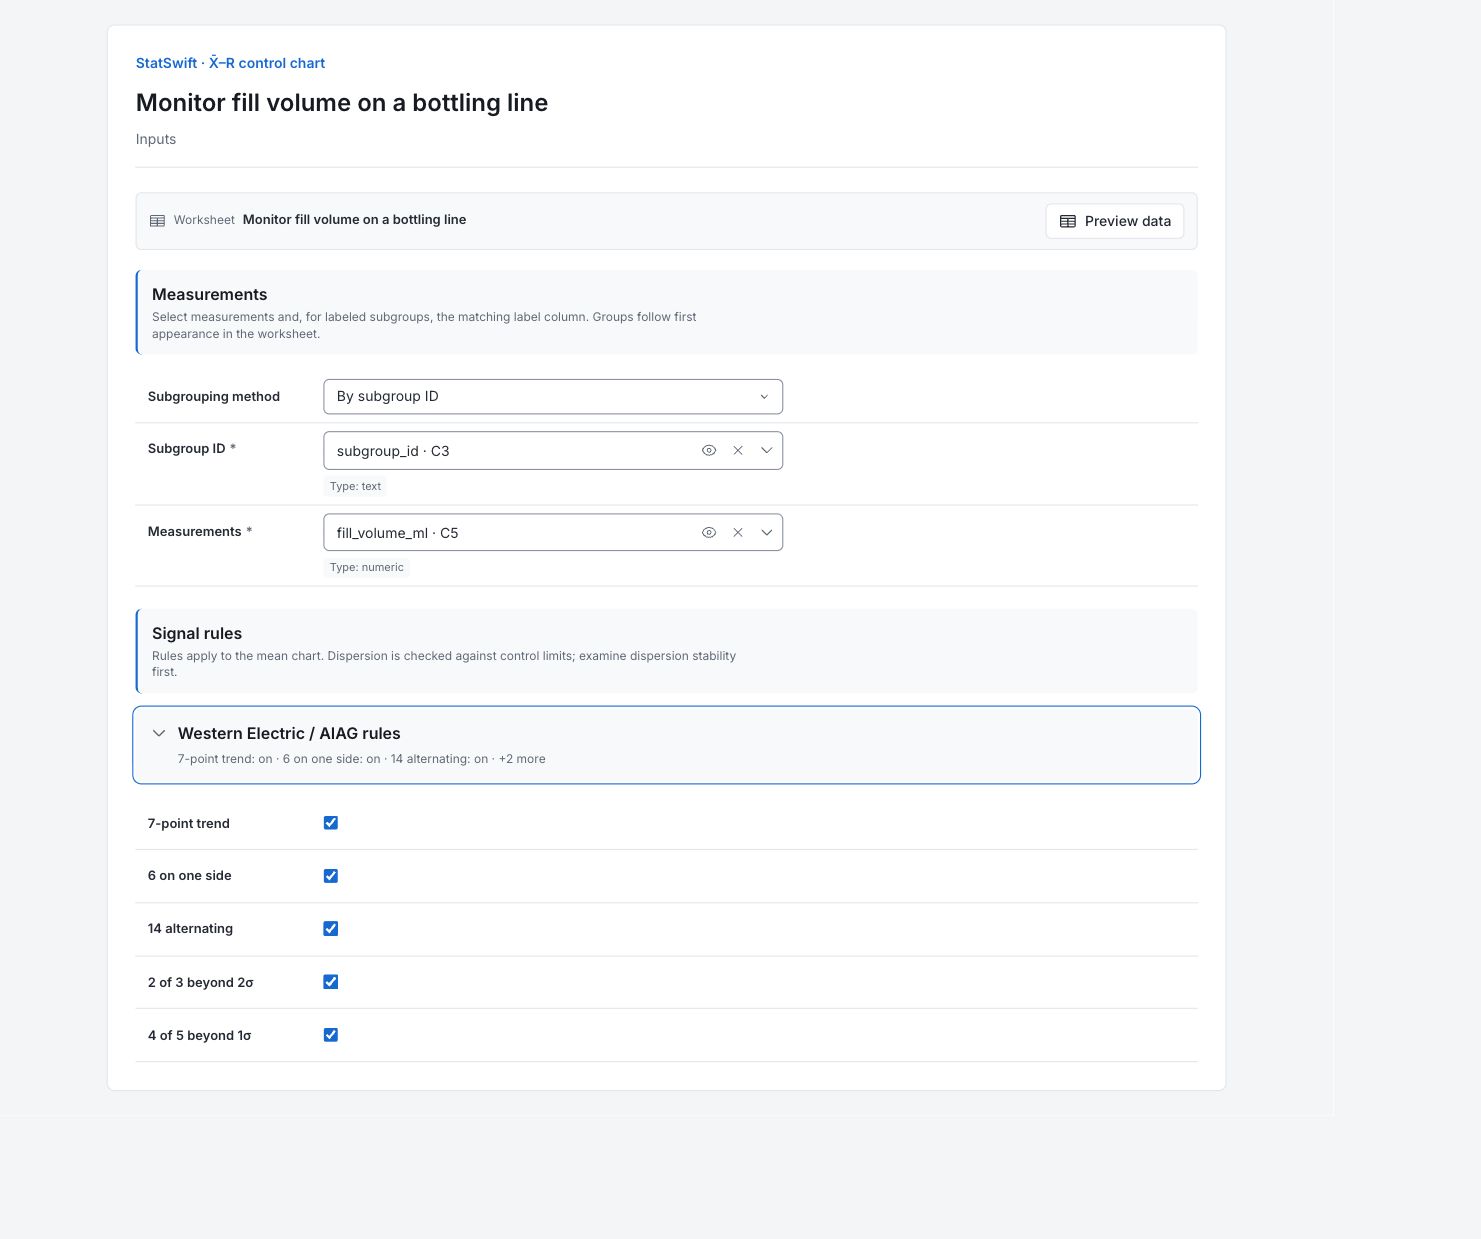
On Inputs, choose By subgroup ID. Assign subgroup_id to Subgroup ID and fill_volume_ml to Measurements, selecting each from the column picker.
Open Western Electric / AIAG rules. Leave all five optional rules On: 7-point trend, 6 on one side, 14 alternating, 2 of 3 beyond 2σ and 4 of 5 beyond 1σ. Each subgroup ID contains five measurements.
4. Run analysis
Choose Run analysis, then open Results.
5. Interpret results
Understand each point
Five bottles were measured every 30 minutes. Each point represents one group of five bottles. Read the charts from left to right, in collection order.
Check the range first
Look at Range chart (R). Each point shows the gap between the fullest and least-full bottle in one group. No points cross the limits, and no range signals are flagged.

Range in mL for 35 groups of five bottles. View full-size chart (opens in a new tab) Check the average
Look at Mean chart (X̄). Each point shows the average fill of five bottles. Group 1 is below the lower limit. Groups 29, 31, 33, 34 and 35 are above the upper limit. The later groups have higher average fills.

Mean fill in mL for 35 groups of five bottles. View full-size chart (opens in a new tab) Read the highlighted points
A highlighted point marks a signal to investigate. Some points are highlighted because of a pattern, even when they stay inside the limits. Several rules can flag the same point, so 65 signal entries do not mean 65 separate problems.
Decide what to investigate
The average fill changes, while the range chart has no flagged points. Check the records for group 1 and the later groups. Look for changes in the filler, product or sampling conditions. The charts show where to investigate; they do not identify the cause.
More details: read each result section
Complete result tables use six significant digits, as in Help.
X̄–R summary
Check Subgroups (k) = 35 and Subgroup size (n) = 5. Grand mean is the average fill across all groups: 500.431 mL. Average R is the average gap within a group: 2.011 mL. Within-subgroup σ estimates bottle-to-bottle variation: 0.865 mL. Subgrouping and the five On/Off rows show how the run was configured. Signals counts rule entries: 65 across 30 mean-chart points and zero range-chart points. It does not count defective bottles.
| Statistic / setting | Value |
|---|---|
| Subgroups (k) | 35 |
| Subgroup size (n) | 5 |
| Grand mean (X̄̄) | 500.431 |
| Average R | 2.01143 |
| Within-subgroup σ | 0.864759 |
| Signals | 65 |
| Subgrouping | By subgroup label |
| 7-point trend | On |
| 6 on one side | On |
| 14 alternating | On |
| 2 of 3 beyond 2σ | On |
| 4 of 5 beyond 1σ | On |
Control limits and zones
CL means center line; LCL and UCL mean lower and upper control limit. The mean chart has a center of 500.431 mL and limits of 499.271 and 501.592 mL. The range chart has a center of 2.011 mL and limits of 0 and 4.252 mL. The ±1σ and ±2σ lines divide the mean chart into zones used by the signal rules. All values are in mL. These limits use all 35 groups, including the later shift. They are not customer acceptance limits or a confirmed stable-process baseline. No range signals does not prove that variation is stable.
| Statistic / setting | Value |
|---|---|
| X̄ CL | 500.431 |
| X̄ LCL | 499.271 |
| X̄ UCL | 501.592 |
| R CL | 2.01143 |
| R LCL | 0 |
| R UCL | 4.25216 |
| X̄ −1σ | 500.045 |
| X̄ +1σ | 500.818 |
| X̄ −2σ | 499.658 |
| X̄ +2σ | 501.205 |
Subgroup means and dispersion
Each row describes one group. Index 1 matches FR01, index 2 matches FR02, and so on. X̄ is the average fill; R is the gap between the largest and smallest fill. For FR01, X̄ is 499.2 mL and R is 2.9 mL. The two signal columns list rules flagged on each chart; None means no rule was flagged for that point. Use the index to find the five source bottles in Worksheet.
| Subgroup index (as returned) | X̄ | R | X̄ signals | R signals |
|---|---|---|---|---|
| 1 | 499.2 | 2.9 | beyond limits | None |
| 2 | 500.62 | 3.1 | None | None |
| 3 | 500.22 | 2.1 | 6 on one side | None |
| 4 | 499.72 | 1.6 | 4 of 5 beyond 1σ, 6 on one side | None |
| 5 | 499.78 | 2.4 | 4 of 5 beyond 1σ, 6 on one side | None |
| 6 | 499.36 | 2.2 | 4 of 5 beyond 1σ, 6 on one side | None |
| 7 | 500.18 | 1.8 | 6 on one side | None |
| 8 | 500.02 | 2.1 | 4 of 5 beyond 1σ, 6 on one side | None |
| 9 | 500.16 | 2 | 6 on one side | None |
| 10 | 499.84 | 1.8 | 6 on one side | None |
| 11 | 500.04 | 1.3 | 6 on one side | None |
| 12 | 500.1 | 2.1 | 6 on one side | None |
| 13 | 500.28 | 1.7 | 6 on one side | None |
| 14 | 499.38 | 2.2 | 6 on one side | None |
| 15 | 500.88 | 0.9 | None | None |
| 16 | 500.02 | 2.9 | 4 of 5 beyond 1σ, 6 on one side | None |
| 17 | 499.8 | 2.9 | 4 of 5 beyond 1σ, 6 on one side | None |
| 18 | 500.12 | 1.7 | 6 on one side | None |
| 19 | 499.32 | 1.7 | 2 of 3 beyond 2σ, 4 of 5 beyond 1σ, 6 on one side | None |
| 20 | 499.92 | 2.6 | 4 of 5 beyond 1σ, 6 on one side | None |
| 21 | 499.64 | 1.9 | 2 of 3 beyond 2σ, 4 of 5 beyond 1σ, 6 on one side | None |
| 22 | 500.74 | 1.7 | None | None |
| 23 | 499.52 | 3.3 | 2 of 3 beyond 2σ, 4 of 5 beyond 1σ | None |
| 24 | 500.12 | 1.5 | None | None |
| 25 | 499.92 | 1.2 | None | None |
| 26 | 500.56 | 2.9 | 6 on one side | None |
| 27 | 501.44 | 1.1 | 2 of 3 beyond 2σ, 4 of 5 beyond 1σ, 6 on one side | None |
| 28 | 501.3 | 1.6 | 2 of 3 beyond 2σ, 4 of 5 beyond 1σ, 6 on one side | None |
| 29 | 501.7 | 3.5 | 2 of 3 beyond 2σ, 4 of 5 beyond 1σ, 6 on one side, beyond limits | None |
| 30 | 501.38 | 1.6 | 2 of 3 beyond 2σ, 4 of 5 beyond 1σ, 6 on one side | None |
| 31 | 502.22 | 2.3 | 2 of 3 beyond 2σ, 4 of 5 beyond 1σ, 6 on one side, beyond limits | None |
| 32 | 501.3 | 1.3 | 2 of 3 beyond 2σ, 4 of 5 beyond 1σ, 6 on one side | None |
| 33 | 501.76 | 0.5 | 2 of 3 beyond 2σ, 4 of 5 beyond 1σ, 6 on one side, beyond limits | None |
| 34 | 502.76 | 1.4 | 2 of 3 beyond 2σ, 4 of 5 beyond 1σ, 6 on one side, beyond limits | None |
| 35 | 501.78 | 2.6 | 2 of 3 beyond 2σ, 4 of 5 beyond 1σ, 6 on one side, beyond limits | None |
Control chart signal details
Each row names a subgroup index, a chart and a rule. Index 29 refers to FR29; X̄ means the mean chart and R means the range chart. Beyond limits means the point crosses a control limit. Other rules flag patterns across several groups. One index can appear more than once because several rules can flag it. Here, 65 entries refer to 30 flagged mean-chart points. No range-chart points are flagged.
| Index (as returned) | Chart | Rule |
|---|---|---|
| 1 | X̄ | beyond limits |
| 10 | X̄ | 6 on one side |
| 11 | X̄ | 6 on one side |
| 12 | X̄ | 6 on one side |
| 13 | X̄ | 6 on one side |
| 14 | X̄ | 6 on one side |
| 16 | X̄ | 4 of 5 beyond 1σ |
| 16 | X̄ | 6 on one side |
| 17 | X̄ | 4 of 5 beyond 1σ |
| 17 | X̄ | 6 on one side |
| 18 | X̄ | 6 on one side |
| 19 | X̄ | 2 of 3 beyond 2σ |
| 19 | X̄ | 4 of 5 beyond 1σ |
| 19 | X̄ | 6 on one side |
| 20 | X̄ | 4 of 5 beyond 1σ |
| 20 | X̄ | 6 on one side |
| 21 | X̄ | 2 of 3 beyond 2σ |
| 21 | X̄ | 4 of 5 beyond 1σ |
| 21 | X̄ | 6 on one side |
| 23 | X̄ | 2 of 3 beyond 2σ |
| 23 | X̄ | 4 of 5 beyond 1σ |
| 26 | X̄ | 6 on one side |
| 27 | X̄ | 2 of 3 beyond 2σ |
| 27 | X̄ | 4 of 5 beyond 1σ |
| 27 | X̄ | 6 on one side |
| 28 | X̄ | 2 of 3 beyond 2σ |
| 28 | X̄ | 4 of 5 beyond 1σ |
| 28 | X̄ | 6 on one side |
| 29 | X̄ | 2 of 3 beyond 2σ |
| 29 | X̄ | 4 of 5 beyond 1σ |
| 29 | X̄ | 6 on one side |
| 29 | X̄ | beyond limits |
| 3 | X̄ | 6 on one side |
| 30 | X̄ | 2 of 3 beyond 2σ |
| 30 | X̄ | 4 of 5 beyond 1σ |
| 30 | X̄ | 6 on one side |
| 31 | X̄ | 2 of 3 beyond 2σ |
| 31 | X̄ | 4 of 5 beyond 1σ |
| 31 | X̄ | 6 on one side |
| 31 | X̄ | beyond limits |
| 32 | X̄ | 2 of 3 beyond 2σ |
| 32 | X̄ | 4 of 5 beyond 1σ |
| 32 | X̄ | 6 on one side |
| 33 | X̄ | 2 of 3 beyond 2σ |
| 33 | X̄ | 4 of 5 beyond 1σ |
| 33 | X̄ | 6 on one side |
| 33 | X̄ | beyond limits |
| 34 | X̄ | 2 of 3 beyond 2σ |
| 34 | X̄ | 4 of 5 beyond 1σ |
| 34 | X̄ | 6 on one side |
| 34 | X̄ | beyond limits |
| 35 | X̄ | 2 of 3 beyond 2σ |
| 35 | X̄ | 4 of 5 beyond 1σ |
| 35 | X̄ | 6 on one side |
| 35 | X̄ | beyond limits |
| 4 | X̄ | 4 of 5 beyond 1σ |
| 4 | X̄ | 6 on one side |
| 5 | X̄ | 4 of 5 beyond 1σ |
| 5 | X̄ | 6 on one side |
| 6 | X̄ | 4 of 5 beyond 1σ |
| 6 | X̄ | 6 on one side |
| 7 | X̄ | 6 on one side |
| 8 | X̄ | 4 of 5 beyond 1σ |
| 8 | X̄ | 6 on one side |
| 9 | X̄ | 6 on one side |
- X̄–R endpoint signal indices start at 1.
6. Create a report
Keep both Mean chart (X̄) and Range chart (R), together with the summary, control limits, subgroup values and signal details. Record the sampling conditions and what you investigated.
Choose Add to report from the completed run. Open Choose individual items and advanced options to select tables and charts, then choose Add to draft. Hidden items stay in the saved analysis.
Name the report and add the purpose of the study and your interpretation. Choose Save, review Preview, then use Export → Download HTML. The example below contains the full selected content, including results beyond one screen.