

Example: adhesive strength
The example records 80 bonded joints, with 20 for each of four adhesive formulations. Strength is measured in MPa.
Download the example data (CSV)This is the same example used in Help. The CSV contains the observations to import.
1. Create the analysis
In the sidebar, open Plots and create an analysis. Name it, select New blank worksheet, then choose Create analysis.
2. Import the data
On Worksheet, choose Import. Select the downloaded CSV or paste its contents. Set the delimiter to Comma, use Decimal dot, and check First row contains column names. Preview the import, then choose Import into worksheet.
3. Assign the input columns
On Inputs, choose Interval in Chart type. In Data arrangement, choose One variable by group.
Open the column picker for Measurement and select lap_shear_strength_mpa. For Grouping column, select adhesive. Each interval will estimate the average strength for one formulation.
4. Set the chart options
In Statistics, enter 95 for Confidence level (%). In Layout, choose First appearance for Order and Side by side for Comparison layout. Keep Blank categories or groups at Exclude and disclose.
Open Labels and enter Compare uncertainty in mean strength in Chart title. Leave Horizontal axis label and Vertical axis label blank so the source labels are used.
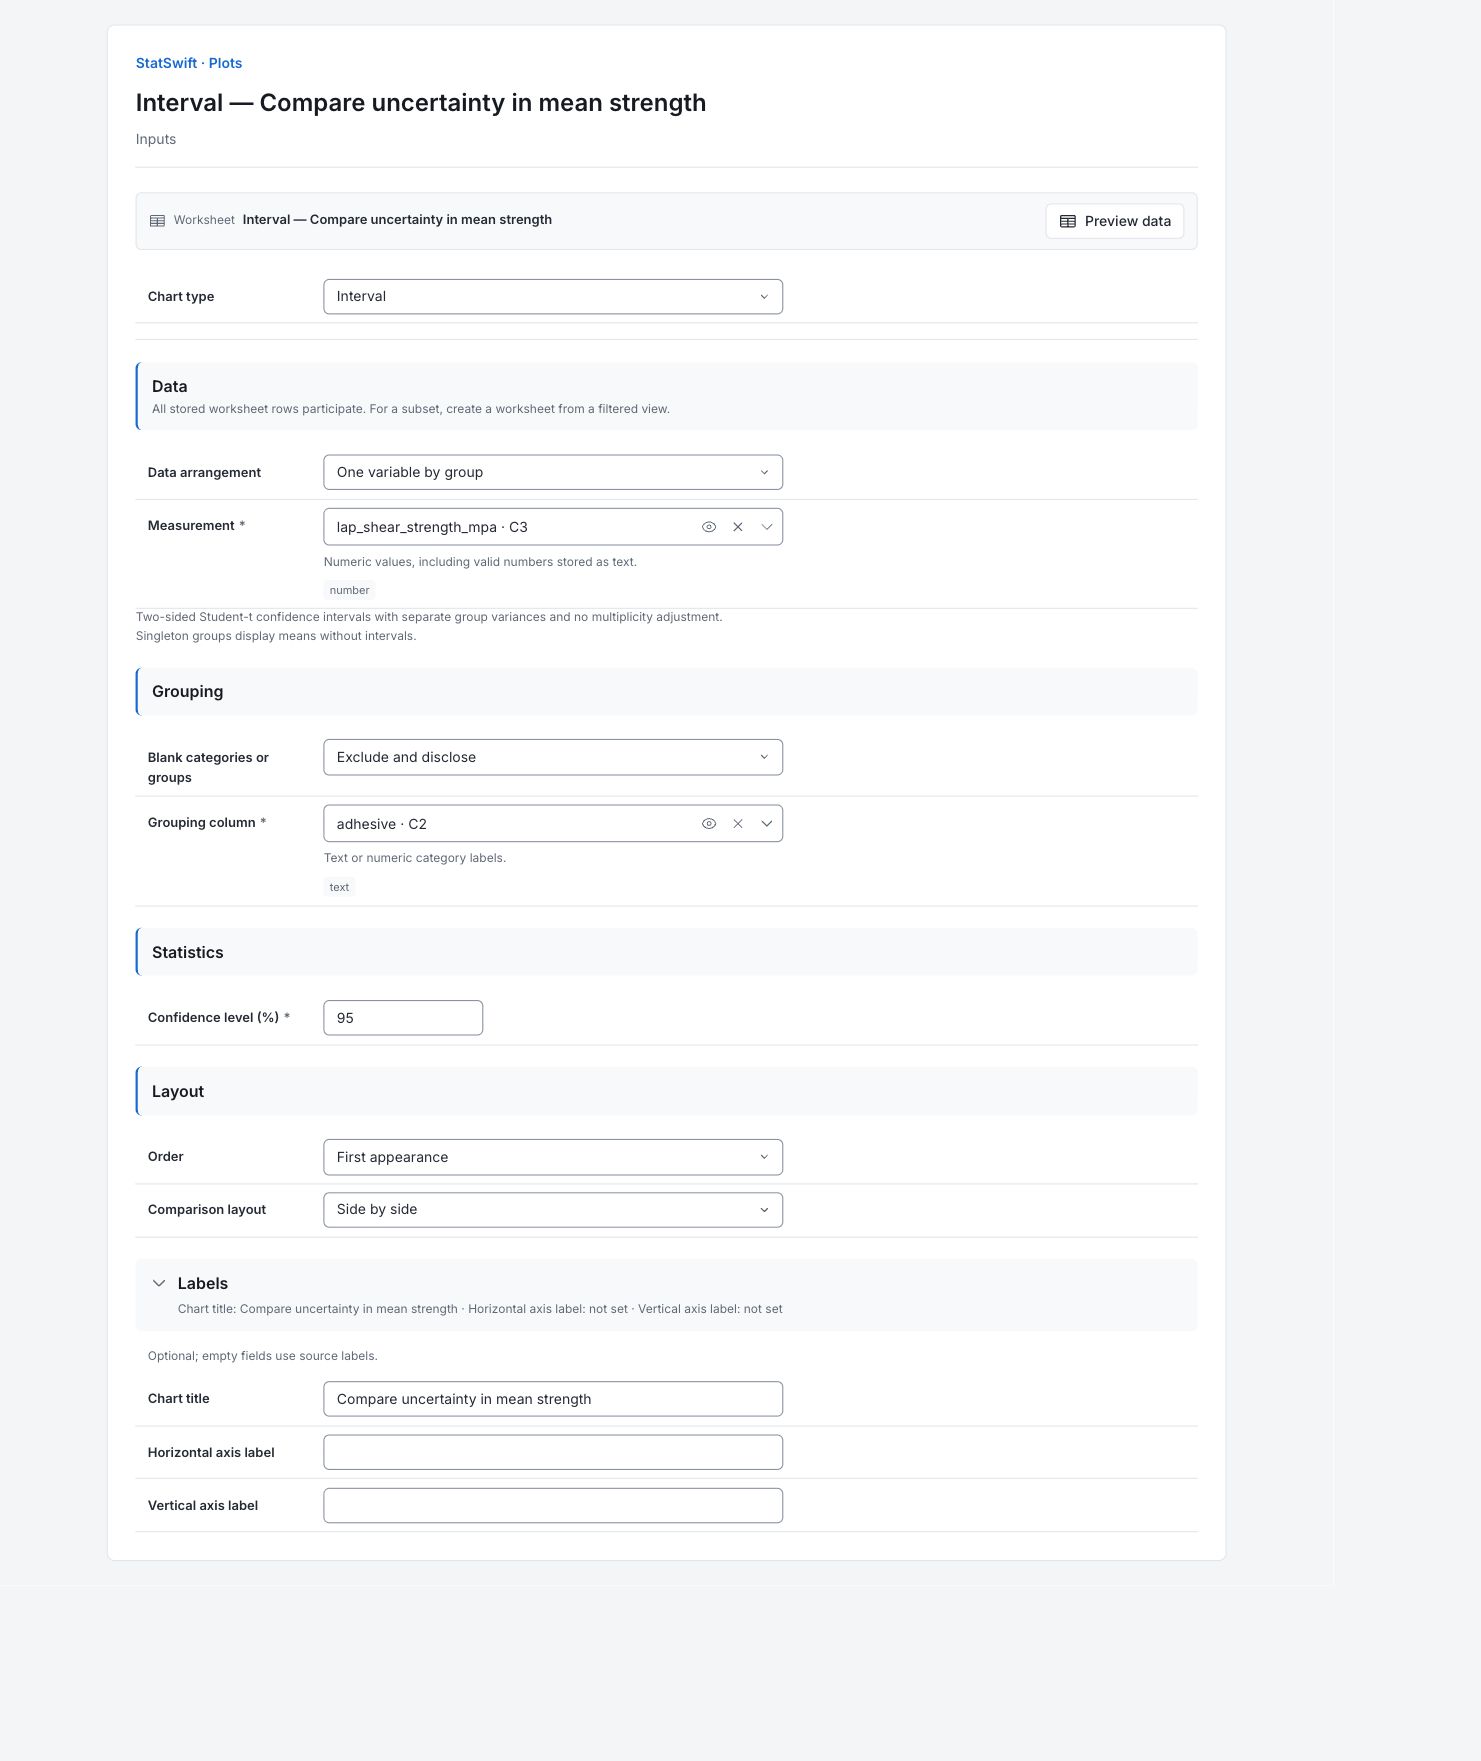
5. Create chart
Choose Create chart, then open Results. Check Data used before comparing the chart with this guide. All stored worksheet rows participate; sorting or filtering the worksheet does not change the analytical sample.
6. Interpret results
Read one interval
Each marker is a sample mean strength in MPa. Its vertical line is a two-sided 95% Student-t confidence interval for that group’s population mean, calculated with its own sample standard deviation. It does not describe the range of individual joint strengths.

Four formulation means and their separate 95% Student-t confidence intervals, with 20 joints per formulation. View full-size chart (opens in a new tab) Compare the estimates
Each formulation has 20 joints. Adhesive_C has a mean of 15.178 MPa, with an interval from 14.6535 to 15.7025 MPa. Adhesive_A has a mean of 12.9655 MPa, with an interval from 12.4592 to 13.4718 MPa.
Understand what uncertainty means
These small-group t intervals assume independent observations, independent groups and roughly normal strength within each group. They are separate intervals, with no adjustment for multiple comparisons. Overlap or separation is not a formal pairwise test.
Choose the next comparison
Check the individual-value plot and the improvement needed in practice. Use an appropriate ANOVA and follow-up comparison when the study design supports them; keep all four intervals in the report.
More details: read each result section
Complete result tables use six significant digits, as in Help.
Data used
Worksheet rows is 80; Eligible observations across series is 80; Excluded observations is 0. All source rows are used. Check these counts and keep the example’s column assignments when comparing runs. Worksheet sorting and filters do not change the analytical sample.
All stored rows are considered in original order. Worksheet sorting and filters do not change the analytical sample.
| Worksheet rows | Eligible observations across series | Excluded observations |
|---|---|---|
| 80 | 80 | 0 |
Data summary
Series names the measurement or group. Valid and Missing give counts; Mean and Median describe the center. Sample SD describes spread. Minimum and Maximum are the observed ends; Q1 and Q3 enclose the middle half. These summaries describe the captured observations, not acceptance limits.
| Series | Valid | Missing | Mean | Sample SD | Minimum | Q1 | Median | Q3 | Maximum |
|---|---|---|---|---|---|---|---|---|---|
| Adhesive_B | 20 | 0 | 13.2955 | 1.2016 | 10.66 | 12.6975 | 13.255 | 14.2325 | 15.34 |
| Adhesive_C | 20 | 0 | 15.178 | 1.12076 | 12.88 | 14.5675 | 15.215 | 15.745 | 17.07 |
| Adhesive_D | 20 | 0 | 14.2415 | 1.07341 | 11.5 | 13.875 | 14.47 | 15.085 | 15.79 |
| Adhesive_A | 20 | 0 | 12.9655 | 1.08188 | 10.27 | 12.4825 | 12.99 | 13.6925 | 15 |
Mean confidence intervals
Each row gives a formulation’s N, Mean and the Lower bound and Upper bound of its 95% mean confidence interval, in MPa. There are 20 joints per formulation. The bounds use separate group sample standard deviations and have no adjustment for multiple comparisons.
| Series | N | Mean | Lower bound | Upper bound |
|---|---|---|---|---|
| Adhesive_B | 20 | 13.2955 | 12.7331 | 13.8579 |
| Adhesive_C | 20 | 15.178 | 14.6535 | 15.7025 |
| Adhesive_D | 20 | 14.2415 | 13.7391 | 14.7439 |
| Adhesive_A | 20 | 12.9655 | 12.4592 | 13.4718 |
7. Create a report
Keep the native chart and Data used, together with Data summary, Mean confidence intervals. Record the column assignments and chart options. State the 95% Student-t method and its sampling assumptions. Keep the distinction between uncertainty in a mean and variation among individual joints.
Choose Add to report from the completed run. Open Choose individual items and advanced options to select tables and charts, then choose Add to draft. Hidden items stay in the saved analysis.
Name the report and add the purpose of the study and your interpretation. Choose Save, review Preview, then use Export → Download HTML. The example below contains the full selected content, including results beyond one screen.