
Example: alignment-pin diameters
A team measures 150 alignment pins in 30 hourly groups of five. The drawing target is 12.000 mm and the specification interval is 11.950–12.050 mm. Process stability has not been established.
Download the alignment-pin example (CSV)This is the same example used in Help. diameter_mm contains diameter in mm; subgroup_id identifies each group of five pins. The other columns record collection order, time and position within the group.
1. Create the workspace
In the sidebar, open Process control, choose Capability & Performance, and name the analysis. Select New blank worksheet and Create analysis.
2. Import the data
On Worksheet, choose Import. Select the downloaded file or paste its contents. Set the delimiter to Comma, use Decimal dot, and check First row contains column names. Preview the import, then choose Import into worksheet. Keep the rows in collection order.
3. Assign the input columns
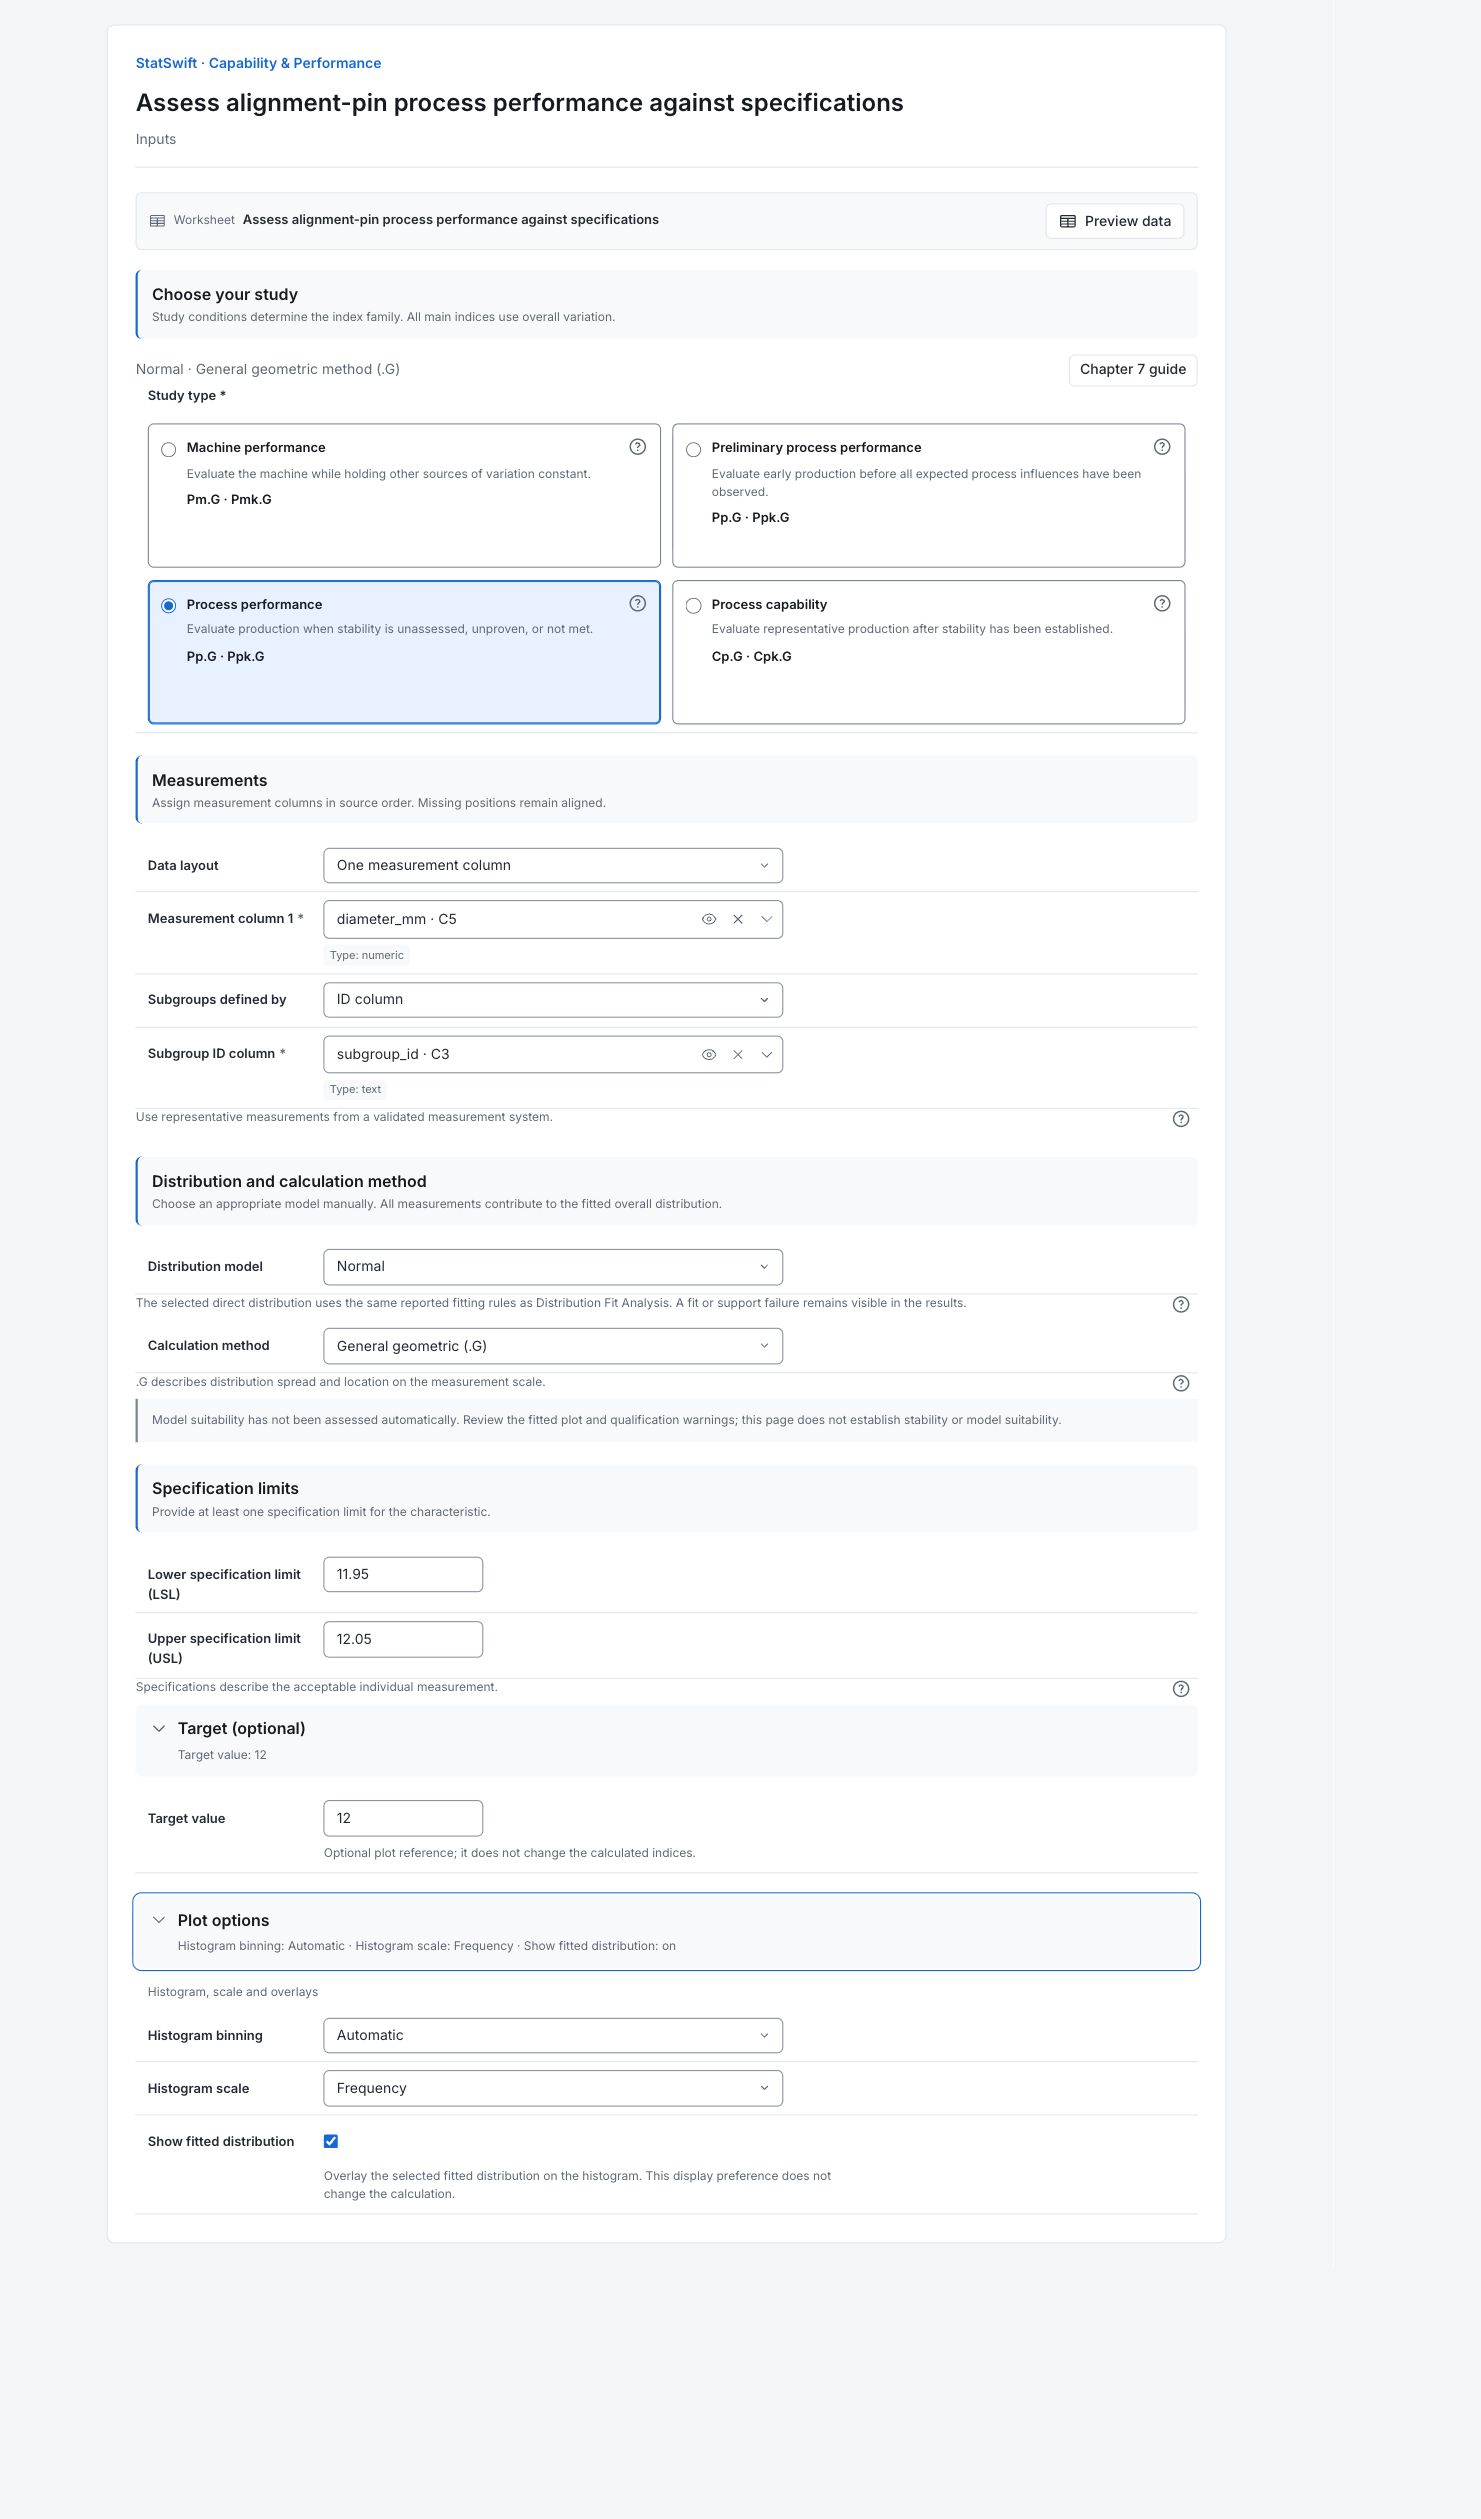
On Inputs, choose Process performance under Study type. Set Data layout to One measurement column and Subgroups defined by to ID column. Assign diameter_mm to Measurement column 1 and subgroup_id to Subgroup ID column, selecting each from the column picker.
4. Set the model and specifications
Choose Normal under Distribution model and General geometric (.G) under Calculation method. Enter 11.950 in Lower specification limit (LSL) and 12.050 in Upper specification limit (USL). Open Target (optional) and enter 12.000 in Target value. All three values use mm.
Open Plot options. Set Histogram binning to Automatic and Histogram scale to Frequency. Leave Show fitted distribution checked. The .G suffix identifies General geometric (.G), the selected way of calculating the performance indices; it is not another set of pin measurements.
5. Run analysis
Choose Run analysis, then open Results.
6. Interpret results
Understand the study
This run describes overall process performance against the supplied drawing specifications. Process stability has not been established, so the results do not establish process capability.
Compare the pins with specifications
All 150 pin diameters are inside 11.950–12.050 mm. Their mean is 12.0124 mm: above the 12.000 mm target and closer to the upper specification. The curve is the fitted normal model. The specification lines describe acceptable pin diameters; they are not control limits.

150 pin diameters in mm, with specification limits, target and fitted normal curve. View full-size chart (opens in a new tab) Check the fitted model
Compare the points with the normal reference line, including the ends of the plot. The app has not automatically assessed whether this model is suitable. This plot also cannot establish stability over time; review a suitable control chart separately.

Normal probability plot of the pin diameters. Review the fit, including the tails. View full-size chart (opens in a new tab) Read the performance indices
The .G suffix names the selected general geometric calculation method. Pp.G describes the fitted spread relative to the specification width. Ppk.G also accounts for the mean’s position between the limits. Here Pp.G is 1.391 and Ppk.G is 1.046; the upper specification is the limiting side.
Separate observed and modeled failures
No sampled pins fail the specifications. The normal model still estimates about 854 failures per million pins, mostly above the upper specification. PPM means parts per million. Zero observed failures in 150 pins does not mean a zero long-term failure rate. The model estimate depends on the model being suitable.
Decide what to investigate
Review why the average lies above the target and how much room remains to the upper specification. Check process stability in collection order and review the model qualifications. Report the zero observed failures separately from the modeled estimate; calculation-validation statements do not establish process stability or model suitability.
More details: read each result section
Complete result tables use six significant digits, as in Help.
Process performance indices
Pp.G is 1.391 and Ppk.G is 1.046. The smaller upper-side index shows that proximity to the upper specification limits the modeled performance. These indices use overall variation in the dataset. They do not establish statistical control or guarantee future performance.
| Statistic | Value |
|---|---|
| Pp.G | 1.39063 |
| PpL.G · Lower specification | 1.7357 |
| PpU.G · Upper specification | 1.04557 |
| Ppk.G | 1.04557 |
- All main C and P indices represent overall variation. Their names identify the study conditions; within-subgroup variation is not substituted.
- General geometric indices compare specification distances with the fitted distribution’s median and 0.135th / 99.865th percentiles. For a normal model, the calculation uses mean ± 3 sample SD.
- Changing the index method for the same fitted model does not change its estimated out-of-specification probabilities.
- — indicates an unavailable result; the reason is shown alongside it.
Observed and expected nonconformance
No out-of-specification items were observed in this sample. The normal model nevertheless estimates about 854 parts per million outside specifications, almost entirely above the upper limit. That estimate extrapolates the fitted tails; it is not an observed defect count.
| Specification side | Observed count | Observed ppm | Expected ppm |
|---|---|---|---|
| Below LSL | 0 | 0 | 0.0959132 |
| Above USL | 0 | 0 | 854.265 |
| Total | 0 | 0 | 854.361 |
- Observed values count measurements strictly outside the specification limits. Expected values use the selected fitted distribution; zero observed failures does not establish zero future risk.
- Not applicable means no specification limit was supplied on that side. A natural boundary is not a specification limit.
Study and model
This is a normal-model process-performance study using the general geometric method and overall variation. A calculation-validation qualification concerns the implementation; it does not certify stability or suitability of these data.
| Setting | Value |
|---|---|
| Study | Process performance |
| Selected distribution model | Normal |
| Calculation method | General geometric (.G) |
| Variation represented by main indices | Overall variation in the full dataset |
| Parameter estimator | Distribution Fit Analysis reported fit |
| Location (original units) | 12.0124 |
| Scale (original units) | 0.0119849 |
| Model support | Lower endpoint: unbounded; upper endpoint: unbounded |
| Lower specification limit | 11.95 |
| Upper specification limit | 12.05 |
| Fit | Available |
| Model source | Fitted for this capability run |
| Validation | Capability calculations checked against the validation dataset. |
- Reference: AIAG–VDA SPC, February 2026 Yellow Volume, Chapter 7 (§7.8.2).
- The selected distribution must adequately describe the measurements, particularly its tails. The histogram and distribution plot support visual review; this run does not establish model suitability or statistical stability.
- No automatic acceptance decision or 1.5σ shift is applied.
Sample statistics
Confirm 150 observations, the mean and the overall standard deviation. Overall variation supplies the main process-performance indices. Subgroup IDs do not turn this into a demonstrated stable-process capability study.
| Statistic | Value |
|---|---|
| Observations (n) | 150 |
| Mean | 12.0124 |
| Standard deviation (overall) | 0.0119849 |
Equivalent normal Z details
Each tail’s Z converts its fitted failure probability to an equivalent normal distance. Z.Bench converts the combined failure probability; with two tails it is not simply three times the smallest index. No 1.5σ shift is applied. These are model-derived values, not time-stability diagnostics.
| Tail | Expected failure probability | Equivalent normal Z |
|---|---|---|
| Lower specification | 9.59132e-8 | 5.20709 |
| Upper specification | 0.000854265 | 3.13671 |
| Both applicable tails (Z.Bench) | 0.000854361 | 3.13668 |
- Each side’s Z is the inverse normal survival probability of that fitted failure tail. Under the Z-score method, its side index equals Z / 3.
- Z.Bench converts the combined failure probability. With two contributing tails, it is not three times the minimum capability index. No 1.5σ shift is applied.
Within-subgroup diagnostics
Read the within-subgroup SD, estimator, usable groups, included/excluded observations and any Cw/Cwk entries as process-improvement diagnostics. Stability is required before treating within variation as inherent variation. A difference from the main indices does not establish stability. The native app omits this diagnostic section from formal reports; it remains available in Results.
For process improvement only. These diagnostics are omitted from formal reports (§7.8.2.5).
| Statistic | Value |
|---|---|
| Cw | 1.34141 |
| Cwk | 1.00856 |
| Standard deviation (within subgroups) | 0.0124248 |
| Estimator | R̄ / d₂ |
| Usable subgroups | 30 |
| Observations included in within estimate | 150 |
| Observations excluded from within estimate | 0 |
- Interpreting within variation as inherent variation requires statistical stability. A difference between the main and within indices does not itself establish stability.
- All measurements remain in the overall calculations. Singleton groups and incomplete trailing fixed-size groups are excluded only from the within estimate; overall standard deviation is never substituted.
7. Create a report
Keep the Capability & performance histogram, Normal probability plot, Study and model, Sample statistics, Process performance indices, Observed and expected nonconformance, and Equivalent normal Z details. Preserve the model qualifications. State that stability is unestablished and distinguish zero observed rejects from the modeled tail estimate.
Choose Add to report from the completed run. Open Choose individual items and advanced options to select tables and charts, then choose Add to draft. Hidden items stay in the saved analysis.
Name the report and add the purpose of the study and your interpretation. Choose Save, review Preview, then use Export → Download HTML. The example below contains the full selected content, including results beyond one screen.