

Example: cosmetic inspection
Two inspectors each classify the same 60 painted housings as Accept or Reject. A quality panel’s reference decision is hidden from them. The study includes clear-cut and borderline cases, with 120 ratings in total.
Download the cosmetic inspection example (CSV)This is the same example used in Help. sample_id identifies the housing, operator_id identifies the inspector, trial is 1, decision contains the inspector’s rating, and reference_decision contains the panel’s reference rating.
1. Create the analysis
In the sidebar, open Measurement systems, choose Kappa (Attributes), and name the analysis. Select New blank worksheet and Create analysis.
2. Import the data
On Worksheet, choose Import. Select the downloaded file or paste its contents. Set the delimiter to Comma, use Decimal dot, and check First row contains column names. Preview the import, then choose Import into worksheet. Keep every row in its original order.
3. Assign the input columns
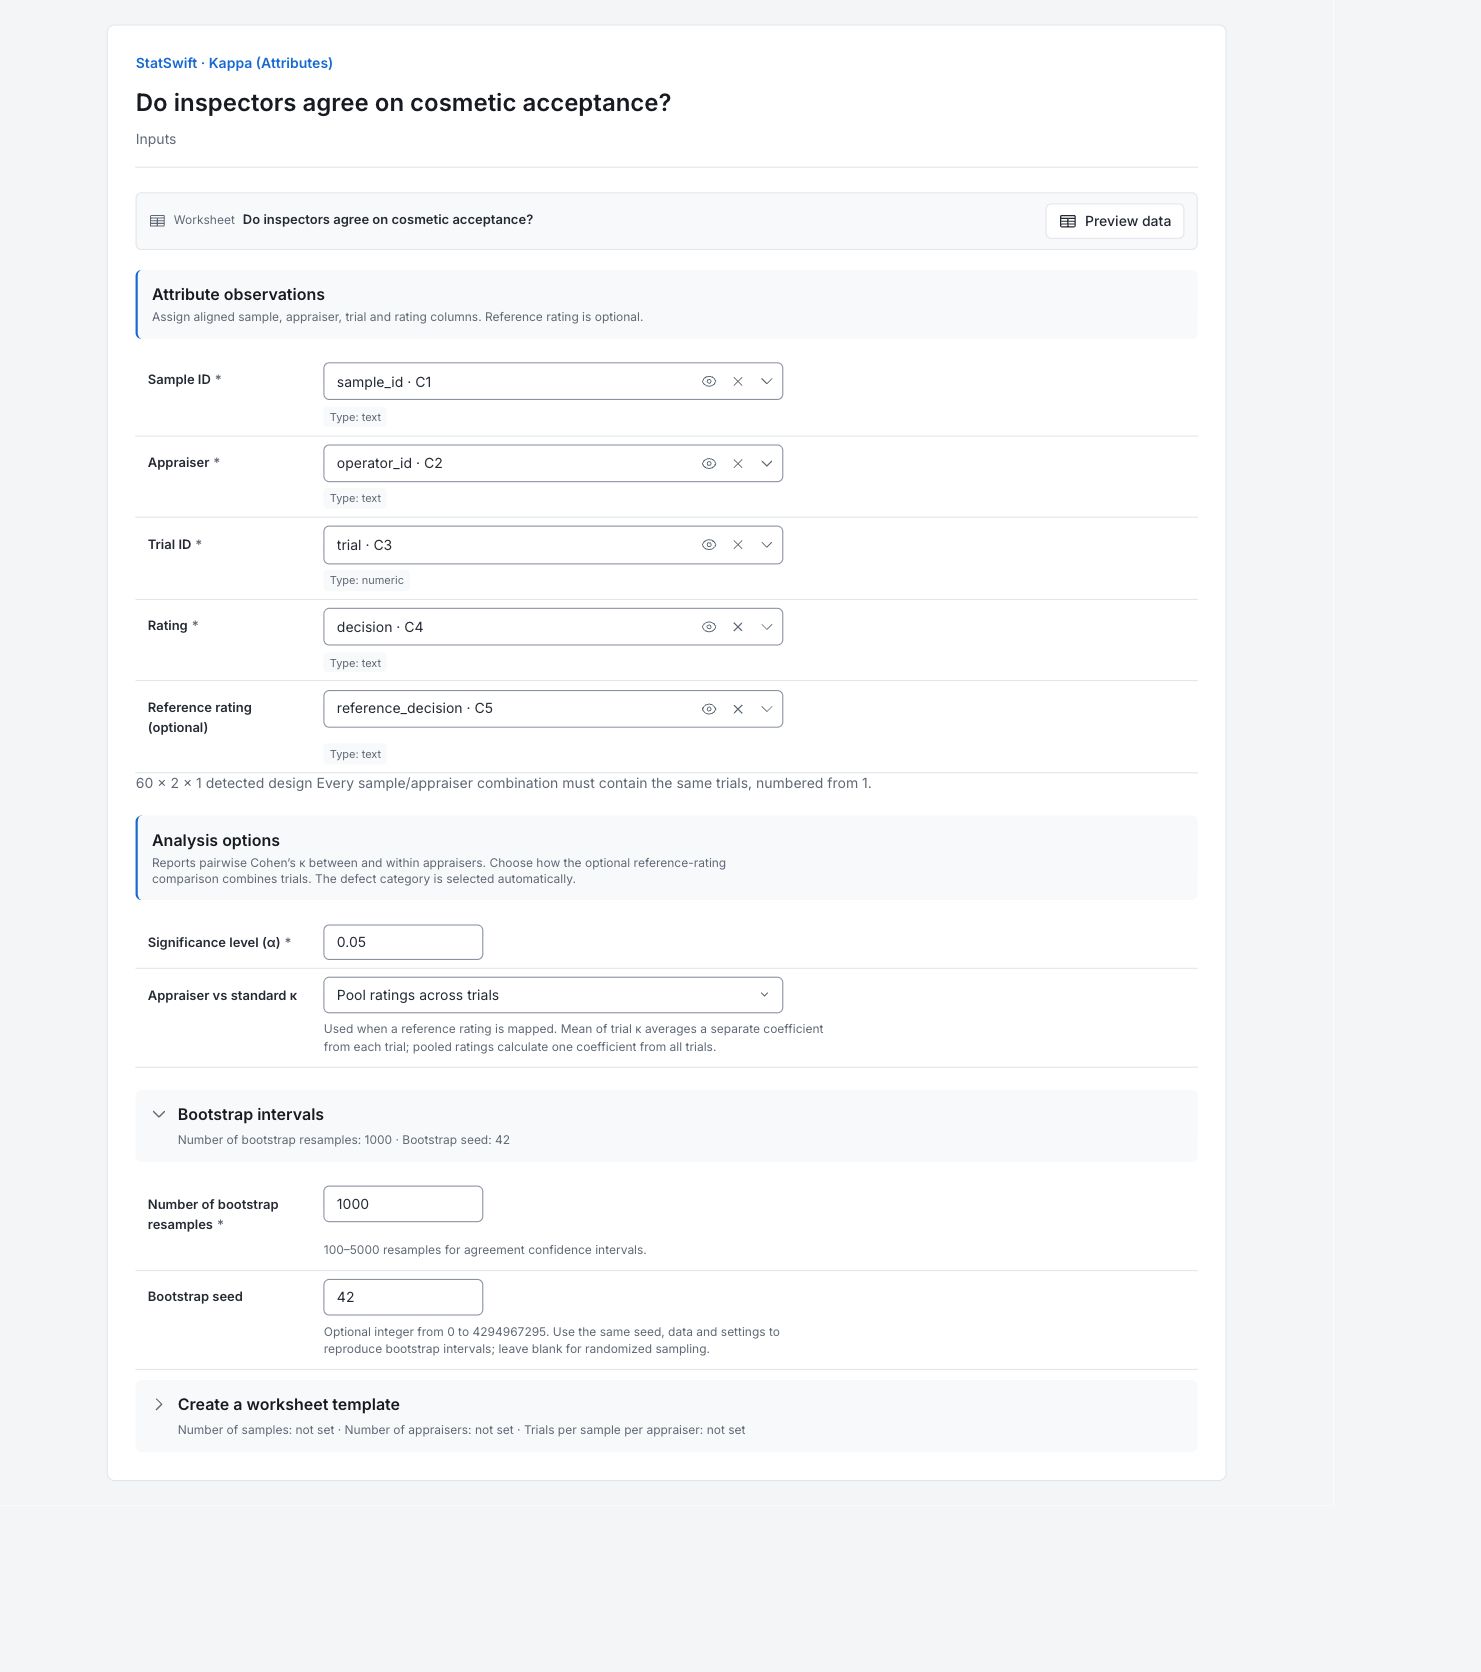
On Inputs, assign sample_id to Sample ID, operator_id to Appraiser, trial to Trial ID, decision to Rating, and reference_decision to Reference rating (optional), selecting each from the column picker.
Check that the app detects 60 × 2 × 1: 60 housings, two inspectors and one trial.
4. Set the study options
Enter 0.05 in Significance level (α). In Appraiser vs standard κ, choose Pool ratings across trials.
Open Bootstrap intervals. Enter 1000 in Number of bootstrap resamples and 42 in Bootstrap seed. Use the same data order and seed to reproduce the intervals. You do not need Create a worksheet template for this imported study. Bootstrap resampling repeatedly samples study housings with replacement to estimate interval uncertainty. The seed fixes that sampling sequence so the intervals can be reproduced; it does not make them more accurate.
5. Run analysis
Choose Run analysis, then open Results.
6. Interpret results
Compare the inspectors
Inspectors agree on 48 of 60 housings, or 80%. The heatmap shows Cohen’s κ = 0.5946, which adjusts agreement for what their rating totals would produce by chance. The 95% interval is about 0.3667–0.7966. κ is not an accuracy percentage.
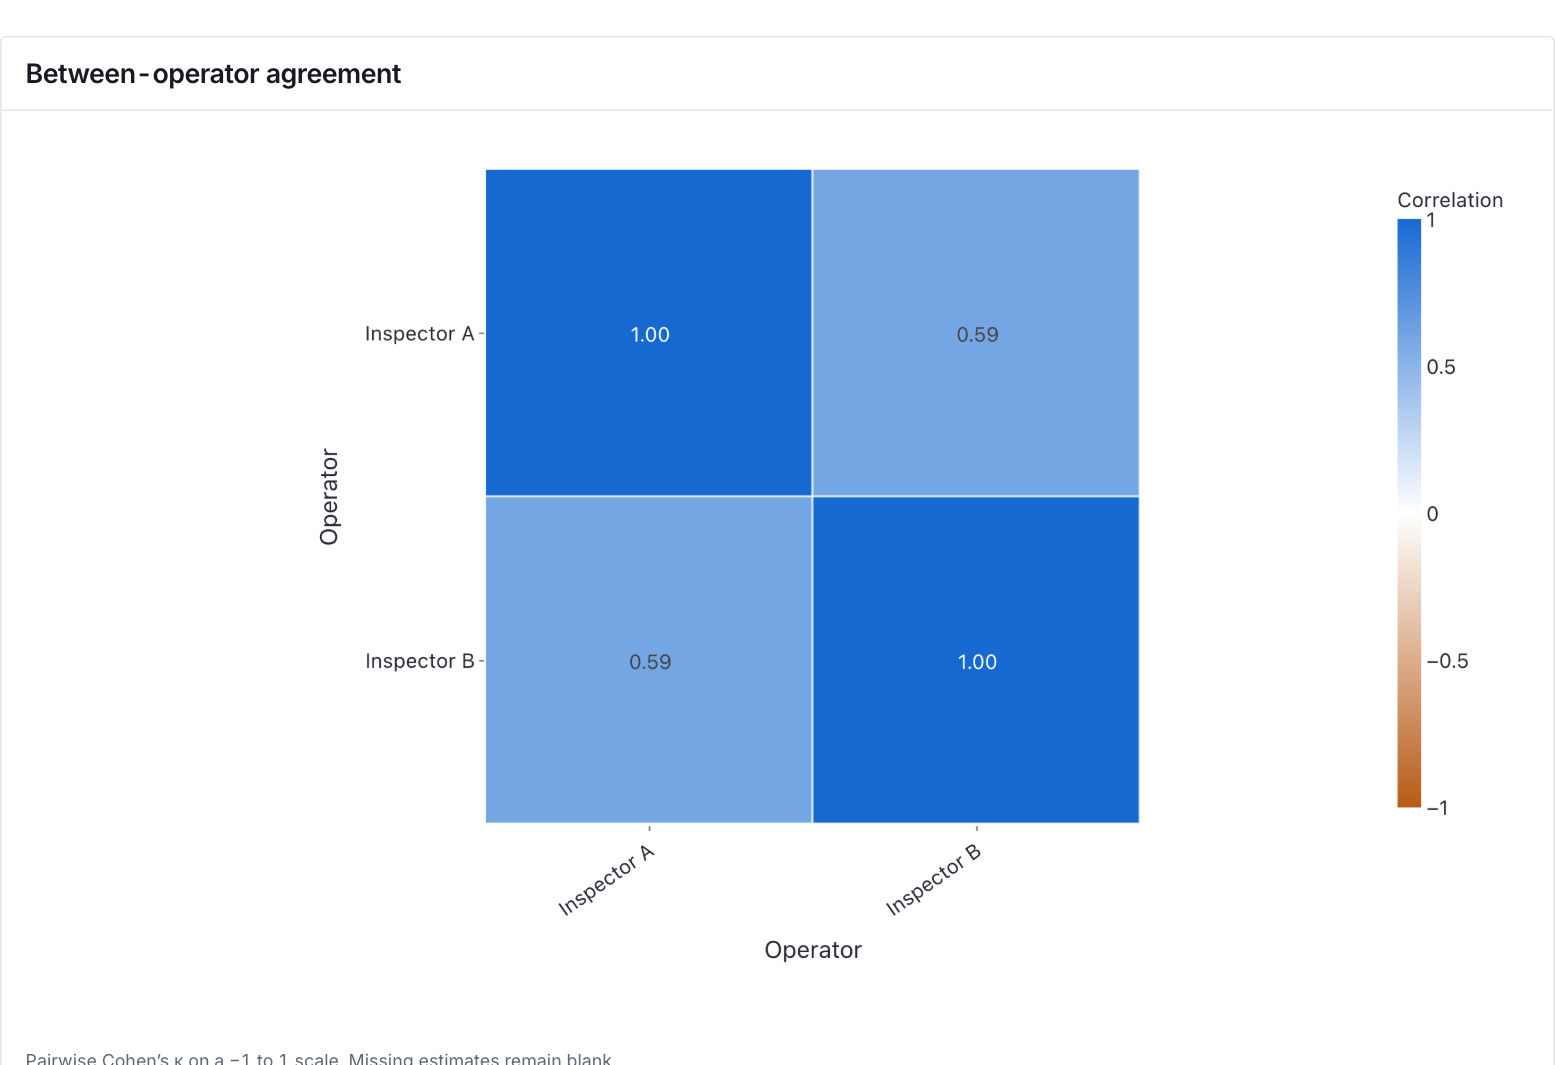
Cohen’s κ between the two inspectors. This is agreement adjusted for chance, not an accuracy percentage. View full-size chart (opens in a new tab) Compare with the reference
Both inspectors match 52 of 60 reference decisions. Inspector A misses four reference rejects and rejects four reference accepts. Inspector B misses two reference rejects and rejects six reference accepts. The same overall match rate hides different error types.
Read the error tables
The arrow reads inspector decision → reference decision. Accept→Reject is a missed reject; Reject→Accept is a false alarm. Miss rates use the 24 reference rejects. False-alarm rates use the 36 reference accepts.
Keep the study design in view
The study contains 60% reference accepts and 40% reference rejects. This mix affects κ and is not the production reject rate. Each inspector rates each housing once, so the study cannot check whether an inspector repeats the same decision reliably.
Decide what to review
Review the disputed housings against the written inspection criteria. Consider missed rejects and false alarms separately. Repeat the study with another trial if you need to assess consistency within each inspector.
More details: read each result section
Complete result tables use six significant digits, as in Help.
Between operators (pairwise κ)
Inspectors agree on 48 of 60 housings (80%). Expected agreement from their category margins is 50.67%, giving Cohen’s κ = 0.5946. The seeded 95% bootstrap interval is about 0.3667–0.7966. κ is not an accuracy percentage, and agreement between inspectors does not establish correctness against the reference.
| First observer / trial | Second observer / trial | Comparisons | Observed agreement P₀ | Expected agreement Pₑ | κ | 95% confidence interval — lower | 95% confidence interval — upper |
|---|---|---|---|---|---|---|---|
| Inspector A | Inspector B | 60 | 0.8 | 0.506667 | 0.594595 | 0.366667 | 0.79661 |
Operator vs standard (accuracy)
Both inspectors match 52 of 60 reference decisions (86.67%). Their κ values differ slightly: 0.7222 for A and 0.7297 for B, because their category margins differ. Reject is treated as the defect category. Miss rates are 16.67% for A and 8.33% for B; false-alarm rates are 11.11% and 16.67%, respectively. These rates use different reference-category denominators.
Vs-standard κ uses one Cohen coefficient from pooled trial ratings. Observed and expected agreement are pooled proportions. Efficiency, miss and false alarm rates are proportions (0–1).
| Operator | Comparisons | Observed agreement P₀ | Expected agreement Pₑ | κ | 95% confidence interval — lower | 95% confidence interval — upper | Efficiency (all) | Efficiency (any) | Miss rate | False alarm rate |
|---|---|---|---|---|---|---|---|---|---|---|
| Inspector A | 60 | 0.866667 | 0.52 | 0.722222 | 0.507042 | 0.893365 | 0.866667 | — | 0.166667 | 0.111111 |
| Inspector B | 60 | 0.866667 | 0.506667 | 0.72973 | 0.533333 | 0.897727 | 0.866667 | — | 0.0833333 | 0.166667 |
Confusion counts — Inspector A vs standard
The arrow reads inspector decision → reference decision. Accept→Reject represents four missed rejects out of 24 reference rejects. Reject→Accept represents four false alarms out of 36 reference accepts. The remaining 52 decisions match the reference.
| Decision → standard | Count |
|---|---|
| Accept→Accept | 32 |
| Accept→Reject | 4 |
| Reject→Accept | 4 |
| Reject→Reject | 20 |
Confusion counts — Inspector B vs standard
Inspector B misses two of the 24 reference rejects and falsely rejects six of the 36 reference accepts. The same total agreement as Inspector A therefore conceals a different balance of error types.
| Decision → standard | Count |
|---|---|
| Accept→Accept | 30 |
| Accept→Reject | 2 |
| Reject→Accept | 6 |
| Reject→Reject | 22 |
Category prevalence
The reference mix is 60% Accept and 40% Reject: 36 and 24 housings. It is the study mix, not an estimate of the production reject rate. Category prevalence affects chance-adjusted agreement, so compare κ values only with suitable context.
| Category | Proportion |
|---|---|
| Accept | 0.6 |
| Reject | 0.4 |
Kappa — study summary
There are 60 samples, two inspectors, and no dropped comparisons. Each inspector rates each sample once, so within-inspector repeatability cannot be assessed. Seed 42 with 1,000 resamples reproduces these bootstrap intervals for the same data, settings and calculation version. Leave the seed blank for randomized sampling.
| Statistic | Value |
|---|---|
| Parts | 60 |
| Operators | Inspector A, Inspector B |
| Categories | Accept, Reject |
| Between/within method | Cohen’s κ |
| Vs standard trial method | Pooled ratings |
| Dropped comparisons | 0 |
| Bootstrap seed | 42 |
Contingency counts — Inspector A / Inspector B
The contingency counts compare Inspector A and Inspector B directly. They explain their observed agreement; use the reference confusion tables to assess missed rejects and false alarms.
| First category | Second category | Count |
|---|---|---|
| Accept | Accept | 28 |
| Accept | Reject | 8 |
| Reject | Accept | 4 |
| Reject | Reject | 20 |
7. Create a report
Keep Between operators (pairwise κ), Operator vs standard (accuracy), both reference confusion-count tables, Category prevalence, Kappa — study summary, the between-inspector contingency counts and agreement heatmap. Record that each inspector rated each housing once.
Choose Add to report from the completed run. Open Choose individual items and advanced options to select tables and charts, then choose Add to draft. Hidden items stay in the saved analysis.
Name the report and add the purpose of the study and your interpretation. Choose Save, review Preview, then use Export → Download HTML. The example below contains the full selected content, including results beyond one screen.