

Example: weld defects
A fabrication shop inspects 40 samples of welded bracket assemblies. Sample sizes vary, but each assembly has the same design and inspected weld length.
Download the weld-defect example (CSV)This Help example uses one row per sample. sample_id identifies it, assemblies_inspected counts the assemblies, and weld_defects counts all separate defects. One assembly can have several defects.
1. Create the chart workspace
In the sidebar, open Process control, choose u Chart, and name the analysis. Select New blank worksheet and Create analysis.
2. Import the data
On Worksheet, choose Import. Select the downloaded file or paste its contents. Set the delimiter to Comma, use Decimal dot, and check First row contains column names. Preview the import, then choose Import into worksheet. Keep the rows in collection order.
3. Assign the input columns
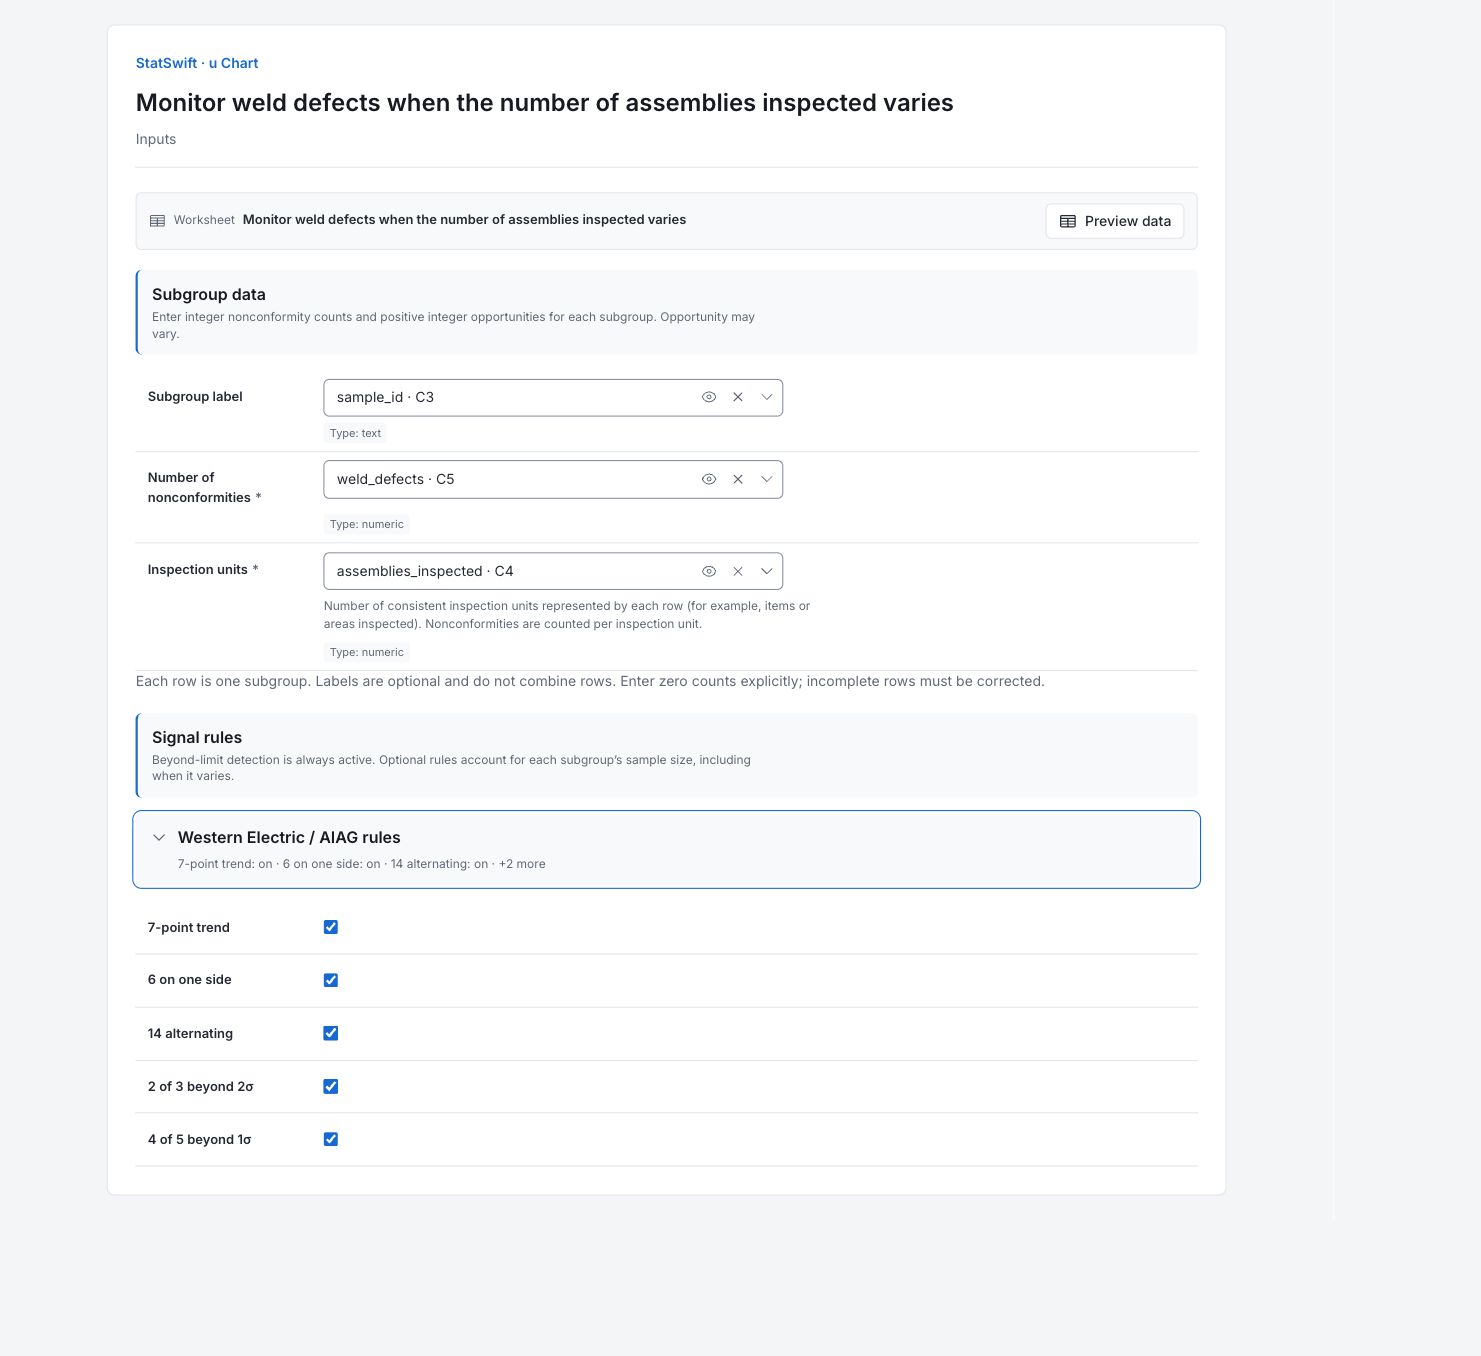
On Inputs, assign sample_id to Subgroup label, weld_defects to Number of nonconformities, and assemblies_inspected to Inspection units, selecting each from the column picker. The inspection unit here is one assembly. The app divides each defect count by the corresponding assembly count.
Open Western Electric / AIAG rules. Leave all five optional rules On: 7-point trend, 6 on one side, 14 alternating, 2 of 3 beyond 2σ and 4 of 5 beyond 1σ.
4. Run analysis
Choose Run analysis, then open Results.
5. Interpret results
Understand each point
Each point is weld defects divided by assemblies inspected. The first sample has 4 defects in 10 assemblies: 4 / 10 = 0.400 defects per assembly. One assembly can have several defects, so a rate can be above one.
Compare the rates with the limits
The overall rate is 0.7601 defects per assembly. WLD34, WLD36, WLD37 and WLD39 cross their upper limits. Samples contain 10–30 assemblies, so each point’s limits reflect how many were inspected.

Weld defects per assembly for 40 samples. Limits reflect each sample’s inspected count. View full-size chart (opens in a new tab) Read the highlighted points
A highlighted point can cross a limit or belong to a pattern inside the limits. Several rules can flag the same sample. Keep the assembly count beside each rate; raw defect totals are not comparable across different sample sizes.
Decide what to investigate
Check the defect and inspection records for WLD34, WLD36, WLD37 and WLD39. Confirm that each assembly had comparable inspected weld length. The chart locates unusual rates; it does not establish a cause.
More details: read each result section
Complete result tables use six significant digits, as in Help.
u chart summary
The rate is weld defects divided by assemblies inspected, not by weld length. A rate can exceed one because an assembly can contain multiple defects. Confirm comparable inspection opportunity per assembly.
| Statistic / setting | Value |
|---|---|
| Subgroups (k) | 40 |
| Overall nonconformities per unit (ū) | 0.760052 |
| Minimum opportunities | 10 |
| Maximum opportunities | 30 |
| Beyond-limit detection | On |
| 7-point trend | On |
| 6 on one side | On |
| 14 alternating | On |
| 2 of 3 beyond 2σ | On |
| 4 of 5 beyond 1σ | On |
- Control limits and zones use each subgroup’s sample size or opportunities.
u values, control limits and zones
Each row lists defects, assemblies inspected, defects per assembly and sample-specific limits. Use WLD labels to find the source inspection. Compare rates rather than raw counts when denominators differ.
| Subgroup | Label | Nonconformities | Opportunities | u | CL | LCL | UCL | −1σ | +1σ | −2σ | +2σ | Signals |
|---|---|---|---|---|---|---|---|---|---|---|---|---|
| 1 | WLD01 | 4 | 10 | 0.4 | 0.760052 | 0 | 1.58712 | 0.484361 | 1.03574 | 0.208671 | 1.31143 | 6 on one side, 4 of 5 beyond 1σ |
| 2 | WLD02 | 12 | 30 | 0.4 | 0.760052 | 0.282542 | 1.23756 | 0.600882 | 0.919222 | 0.441712 | 1.07839 | 6 on one side, 6 on one side, 4 of 5 beyond 1σ, 4 of 5 beyond 1σ |
| 3 | WLD03 | 3 | 10 | 0.3 | 0.760052 | 0 | 1.58712 | 0.484361 | 1.03574 | 0.208671 | 1.31143 | 6 on one side, 6 on one side, 6 on one side, 4 of 5 beyond 1σ, 4 of 5 beyond 1σ |
| 4 | WLD04 | 17 | 23 | 0.73913 | 0.760052 | 0.214697 | 1.30541 | 0.578267 | 0.941837 | 0.396482 | 1.12362 | 6 on one side, 6 on one side, 6 on one side, 6 on one side |
| 5 | WLD05 | 13 | 26 | 0.5 | 0.760052 | 0.247124 | 1.27298 | 0.589076 | 0.931028 | 0.4181 | 1.102 | 6 on one side, 6 on one side, 6 on one side, 6 on one side, 6 on one side, 4 of 5 beyond 1σ, 4 of 5 beyond 1σ, 4 of 5 beyond 1σ |
| 6 | WLD06 | 12 | 22 | 0.545455 | 0.760052 | 0.202441 | 1.31766 | 0.574181 | 0.945922 | 0.388311 | 1.13179 | 6 on one side, 6 on one side, 6 on one side, 6 on one side, 6 on one side, 4 of 5 beyond 1σ, 4 of 5 beyond 1σ, 4 of 5 beyond 1σ |
| 7 | WLD07 | 8 | 13 | 0.615385 | 0.760052 | 0.0346625 | 1.48544 | 0.518255 | 1.00185 | 0.276459 | 1.24364 | 6 on one side, 6 on one side, 6 on one side, 6 on one side |
| 8 | WLD08 | 9 | 17 | 0.529412 | 0.760052 | 0.125717 | 1.39439 | 0.548607 | 0.971497 | 0.337162 | 1.18294 | 6 on one side, 6 on one side, 6 on one side, 4 of 5 beyond 1σ, 4 of 5 beyond 1σ, 4 of 5 beyond 1σ |
| 9 | WLD09 | 17 | 30 | 0.566667 | 0.760052 | 0.282542 | 1.23756 | 0.600882 | 0.919222 | 0.441712 | 1.07839 | 6 on one side, 6 on one side, 4 of 5 beyond 1σ, 4 of 5 beyond 1σ, 4 of 5 beyond 1σ |
| 10 | WLD10 | 10 | 24 | 0.416667 | 0.760052 | 0.22618 | 1.29392 | 0.582095 | 0.938009 | 0.404137 | 1.11597 | 6 on one side, 4 of 5 beyond 1σ, 4 of 5 beyond 1σ |
| 11 | WLD11 | 17 | 17 | 1 | 0.760052 | 0.125717 | 1.39439 | 0.548607 | 0.971497 | 0.337162 | 1.18294 | None |
| 12 | WLD12 | 3 | 11 | 0.272727 | 0.760052 | 0 | 1.54863 | 0.497191 | 1.02291 | 0.234331 | 1.28577 | 4 of 5 beyond 1σ |
| 13 | WLD13 | 13 | 18 | 0.722222 | 0.760052 | 0.143589 | 1.37651 | 0.554564 | 0.965539 | 0.349077 | 1.17103 | None |
| 14 | WLD14 | 8 | 10 | 0.8 | 0.760052 | 0 | 1.58712 | 0.484361 | 1.03574 | 0.208671 | 1.31143 | None |
| 15 | WLD15 | 8 | 14 | 0.571429 | 0.760052 | 0.0610492 | 1.45905 | 0.527051 | 0.993053 | 0.29405 | 1.22605 | None |
| 16 | WLD16 | 17 | 22 | 0.772727 | 0.760052 | 0.202441 | 1.31766 | 0.574181 | 0.945922 | 0.388311 | 1.13179 | None |
| 17 | WLD17 | 7 | 17 | 0.411765 | 0.760052 | 0.125717 | 1.39439 | 0.548607 | 0.971497 | 0.337162 | 1.18294 | 6 on one side |
| 18 | WLD18 | 11 | 16 | 0.6875 | 0.760052 | 0.106195 | 1.41391 | 0.542099 | 0.978004 | 0.324147 | 1.19596 | 6 on one side |
| 19 | WLD19 | 13 | 22 | 0.590909 | 0.760052 | 0.202441 | 1.31766 | 0.574181 | 0.945922 | 0.388311 | 1.13179 | 6 on one side |
| 20 | WLD20 | 10 | 16 | 0.625 | 0.760052 | 0.106195 | 1.41391 | 0.542099 | 0.978004 | 0.324147 | 1.19596 | 6 on one side |
| 21 | WLD21 | 21 | 28 | 0.75 | 0.760052 | 0.265782 | 1.25432 | 0.595295 | 0.924808 | 0.430539 | 1.08956 | 6 on one side |
| 22 | WLD22 | 7 | 11 | 0.636364 | 0.760052 | 0 | 1.54863 | 0.497191 | 1.02291 | 0.234331 | 1.28577 | 6 on one side |
| 23 | WLD23 | 9 | 10 | 0.9 | 0.760052 | 0 | 1.58712 | 0.484361 | 1.03574 | 0.208671 | 1.31143 | None |
| 24 | WLD24 | 18 | 24 | 0.75 | 0.760052 | 0.22618 | 1.29392 | 0.582095 | 0.938009 | 0.404137 | 1.11597 | None |
| 25 | WLD25 | 12 | 23 | 0.521739 | 0.760052 | 0.214697 | 1.30541 | 0.578267 | 0.941837 | 0.396482 | 1.12362 | None |
| 26 | WLD26 | 17 | 24 | 0.708333 | 0.760052 | 0.22618 | 1.29392 | 0.582095 | 0.938009 | 0.404137 | 1.11597 | None |
| 27 | WLD27 | 18 | 27 | 0.666667 | 0.760052 | 0.256712 | 1.26339 | 0.592272 | 0.927832 | 0.424492 | 1.09561 | None |
| 28 | WLD28 | 21 | 30 | 0.7 | 0.760052 | 0.282542 | 1.23756 | 0.600882 | 0.919222 | 0.441712 | 1.07839 | None |
| 29 | WLD29 | 21 | 24 | 0.875 | 0.760052 | 0.22618 | 1.29392 | 0.582095 | 0.938009 | 0.404137 | 1.11597 | None |
| 30 | WLD30 | 4 | 12 | 0.333333 | 0.760052 | 0.00504267 | 1.51506 | 0.508382 | 1.01172 | 0.256712 | 1.26339 | None |
| 31 | WLD31 | 11 | 18 | 0.611111 | 0.760052 | 0.143589 | 1.37651 | 0.554564 | 0.965539 | 0.349077 | 1.17103 | None |
| 32 | WLD32 | 7 | 13 | 0.538462 | 0.760052 | 0.0346625 | 1.48544 | 0.518255 | 1.00185 | 0.276459 | 1.24364 | None |
| 33 | WLD33 | 10 | 18 | 0.555556 | 0.760052 | 0.143589 | 1.37651 | 0.554564 | 0.965539 | 0.349077 | 1.17103 | None |
| 34 | WLD34 | 39 | 24 | 1.625 | 0.760052 | 0.22618 | 1.29392 | 0.582095 | 0.938009 | 0.404137 | 1.11597 | Beyond 3σ, 6 on one side, 2 of 3 beyond 2σ, 2 of 3 beyond 2σ, 4 of 5 beyond 1σ, 4 of 5 beyond 1σ |
| 35 | WLD35 | 23 | 20 | 1.15 | 0.760052 | 0.175224 | 1.34488 | 0.565109 | 0.954994 | 0.370167 | 1.14994 | 6 on one side, 6 on one side, 2 of 3 beyond 2σ, 2 of 3 beyond 2σ, 2 of 3 beyond 2σ, 4 of 5 beyond 1σ, 4 of 5 beyond 1σ, 4 of 5 beyond 1σ |
| 36 | WLD36 | 20 | 11 | 1.81818 | 0.760052 | 0 | 1.54863 | 0.497191 | 1.02291 | 0.234331 | 1.28577 | Beyond 3σ, 6 on one side, 6 on one side, 2 of 3 beyond 2σ, 2 of 3 beyond 2σ, 2 of 3 beyond 2σ, 4 of 5 beyond 1σ, 4 of 5 beyond 1σ, 4 of 5 beyond 1σ, 4 of 5 beyond 1σ |
| 37 | WLD37 | 31 | 23 | 1.34783 | 0.760052 | 0.214697 | 1.30541 | 0.578267 | 0.941837 | 0.396482 | 1.12362 | Beyond 3σ, 6 on one side, 6 on one side, 2 of 3 beyond 2σ, 2 of 3 beyond 2σ, 2 of 3 beyond 2σ, 4 of 5 beyond 1σ, 4 of 5 beyond 1σ, 4 of 5 beyond 1σ, 4 of 5 beyond 1σ |
| 38 | WLD38 | 21 | 16 | 1.3125 | 0.760052 | 0.106195 | 1.41391 | 0.542099 | 0.978004 | 0.324147 | 1.19596 | 6 on one side, 6 on one side, 2 of 3 beyond 2σ, 2 of 3 beyond 2σ, 2 of 3 beyond 2σ, 4 of 5 beyond 1σ, 4 of 5 beyond 1σ, 4 of 5 beyond 1σ |
| 39 | WLD39 | 29 | 18 | 1.61111 | 0.760052 | 0.143589 | 1.37651 | 0.554564 | 0.965539 | 0.349077 | 1.17103 | Beyond 3σ, 6 on one side, 6 on one side, 2 of 3 beyond 2σ, 2 of 3 beyond 2σ, 4 of 5 beyond 1σ, 4 of 5 beyond 1σ |
| 40 | WLD40 | 35 | 29 | 1.2069 | 0.760052 | 0.274379 | 1.24572 | 0.598161 | 0.921943 | 0.43627 | 1.08383 | 6 on one side, 2 of 3 beyond 2σ, 4 of 5 beyond 1σ |
Control chart signal details
Each row names an inspection index or label and a rule. Beyond limits identifies a crossing; other rules flag patterns that may stay inside the limits. Several rules may flag the same sample. These entries identify inspections to investigate, not the number of defective assemblies.
| Index (as returned) | Chart | Rule |
|---|---|---|
| 0 | u | 4 of 5 beyond 1σ |
| 0 | u | 6 on one side |
| 1 | u | 4 of 5 beyond 1σ |
| 1 | u | 4 of 5 beyond 1σ |
| 1 | u | 6 on one side |
| 1 | u | 6 on one side |
| 11 | u | 4 of 5 beyond 1σ |
| 16 | u | 6 on one side |
| 17 | u | 6 on one side |
| 18 | u | 6 on one side |
| 19 | u | 6 on one side |
| 2 | u | 4 of 5 beyond 1σ |
| 2 | u | 4 of 5 beyond 1σ |
| 2 | u | 6 on one side |
| 2 | u | 6 on one side |
| 2 | u | 6 on one side |
| 20 | u | 6 on one side |
| 21 | u | 6 on one side |
| 3 | u | 6 on one side |
| 3 | u | 6 on one side |
| 3 | u | 6 on one side |
| 3 | u | 6 on one side |
| 33 | u | 2 of 3 beyond 2σ |
| 33 | u | 2 of 3 beyond 2σ |
| 33 | u | 4 of 5 beyond 1σ |
| 33 | u | 4 of 5 beyond 1σ |
| 33 | u | 6 on one side |
| 33 | u | Beyond 3σ |
| 34 | u | 2 of 3 beyond 2σ |
| 34 | u | 2 of 3 beyond 2σ |
| 34 | u | 2 of 3 beyond 2σ |
| 34 | u | 4 of 5 beyond 1σ |
| 34 | u | 4 of 5 beyond 1σ |
| 34 | u | 4 of 5 beyond 1σ |
| 34 | u | 6 on one side |
| 34 | u | 6 on one side |
| 35 | u | 2 of 3 beyond 2σ |
| 35 | u | 2 of 3 beyond 2σ |
| 35 | u | 2 of 3 beyond 2σ |
| 35 | u | 4 of 5 beyond 1σ |
| 35 | u | 4 of 5 beyond 1σ |
| 35 | u | 4 of 5 beyond 1σ |
| 35 | u | 4 of 5 beyond 1σ |
| 35 | u | 6 on one side |
| 35 | u | 6 on one side |
| 35 | u | Beyond 3σ |
| 36 | u | 2 of 3 beyond 2σ |
| 36 | u | 2 of 3 beyond 2σ |
| 36 | u | 2 of 3 beyond 2σ |
| 36 | u | 4 of 5 beyond 1σ |
| 36 | u | 4 of 5 beyond 1σ |
| 36 | u | 4 of 5 beyond 1σ |
| 36 | u | 4 of 5 beyond 1σ |
| 36 | u | 6 on one side |
| 36 | u | 6 on one side |
| 36 | u | Beyond 3σ |
| 37 | u | 2 of 3 beyond 2σ |
| 37 | u | 2 of 3 beyond 2σ |
| 37 | u | 2 of 3 beyond 2σ |
| 37 | u | 4 of 5 beyond 1σ |
| 37 | u | 4 of 5 beyond 1σ |
| 37 | u | 4 of 5 beyond 1σ |
| 37 | u | 6 on one side |
| 37 | u | 6 on one side |
| 38 | u | 2 of 3 beyond 2σ |
| 38 | u | 2 of 3 beyond 2σ |
| 38 | u | 4 of 5 beyond 1σ |
| 38 | u | 4 of 5 beyond 1σ |
| 38 | u | 6 on one side |
| 38 | u | 6 on one side |
| 38 | u | Beyond 3σ |
| 39 | u | 2 of 3 beyond 2σ |
| 39 | u | 4 of 5 beyond 1σ |
| 39 | u | 6 on one side |
| 4 | u | 4 of 5 beyond 1σ |
| 4 | u | 4 of 5 beyond 1σ |
| 4 | u | 4 of 5 beyond 1σ |
| 4 | u | 6 on one side |
| 4 | u | 6 on one side |
| 4 | u | 6 on one side |
| 4 | u | 6 on one side |
| 4 | u | 6 on one side |
| 5 | u | 4 of 5 beyond 1σ |
| 5 | u | 4 of 5 beyond 1σ |
| 5 | u | 4 of 5 beyond 1σ |
| 5 | u | 6 on one side |
| 5 | u | 6 on one side |
| 5 | u | 6 on one side |
| 5 | u | 6 on one side |
| 5 | u | 6 on one side |
| 6 | u | 6 on one side |
| 6 | u | 6 on one side |
| 6 | u | 6 on one side |
| 6 | u | 6 on one side |
| 7 | u | 4 of 5 beyond 1σ |
| 7 | u | 4 of 5 beyond 1σ |
| 7 | u | 4 of 5 beyond 1σ |
| 7 | u | 6 on one side |
| 7 | u | 6 on one side |
| 7 | u | 6 on one side |
| 8 | u | 4 of 5 beyond 1σ |
| 8 | u | 4 of 5 beyond 1σ |
| 8 | u | 4 of 5 beyond 1σ |
| 8 | u | 6 on one side |
| 8 | u | 6 on one side |
| 9 | u | 4 of 5 beyond 1σ |
| 9 | u | 4 of 5 beyond 1σ |
| 9 | u | 6 on one side |
- Endpoint signal indices start at 0; chart subgroup numbers start at 1.
6. Create a report
Keep the u control chart, summary, sample rates and limits, and signal details. State that rates are defects per assembly and that inspected weld length is comparable across assemblies. Record your investigation of WLD34, WLD36, WLD37 and WLD39.
Choose Add to report from the completed run. Open Choose individual items and advanced options to select tables and charts, then choose Add to draft. Hidden items stay in the saved analysis.
Name the report and add the purpose of the study and your interpretation. Choose Save, review Preview, then use Export → Download HTML. The example below contains the full selected content, including results beyond one screen.